
Navarre, FL
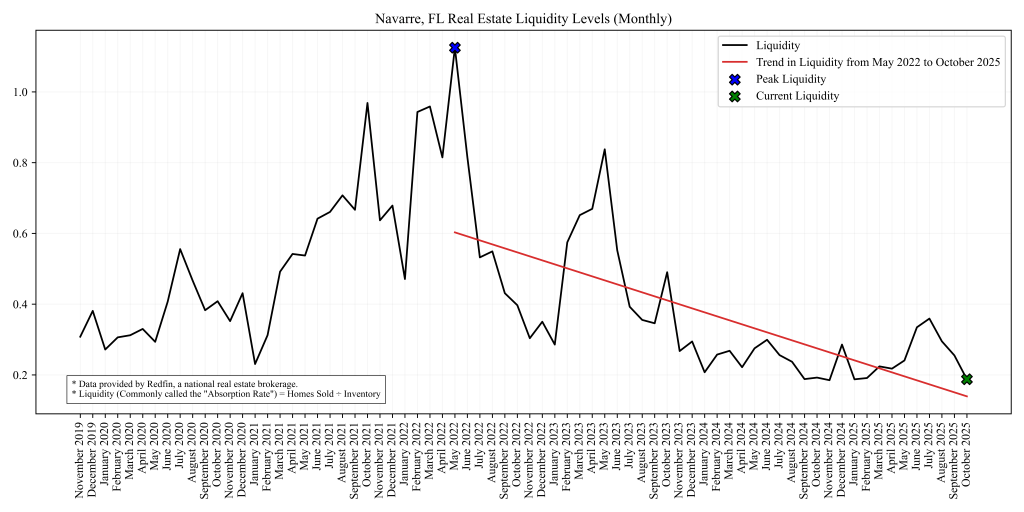
Liquidity1 fell ~26.41% from September 2025 to October 2025. A drop of this magnitude in a single month suggests fewer buyers acting on available listings despite inventory conditions remaining relatively stable.
The peak of Navarre’s liquidity occurred in May 2022, when homes were selling at a rate of 1.125 times the standing inventory2. Since this peak, liquidity has fallen 83.31%, reflecting a dramatic long-term slowdown in buyer demand in the area relative to available homes.
Navarre Beach, FL
The Navarre Beach area has seen similar declines. Liquidity in Navarre Beach fell 29.35% from September 2025 to October 2025 indicating the same lack of buyer activity.
The peak of Navarre Beach’s liquidity occurred in April 2022, just one month behind Navarre, when homes were selling at a rate of 0.7419 times the standing inventory. Since April 2022, liquidity has dropped 91.42% as of October 2025.

Data Source: Redfin, a national real estate brokerage.
